15 Strategies, 9 Pairs, 20 Years: What the Backtest Data Actually Says
I ran 15 systematic strategies across 9 forex pairs over 20 years of H1 data. The results challenge most assumptions about market microstructure and strategy design.

The Setup
Nine assets: GBP/JPY, XAU/USD, EUR/USD, GBP/USD, USD/CAD, USD/JPY, AUD/USD, NZD/USD, USD/CHF. Fifteen strategies, each backtested on roughly 175,000-694,000 bars depending on the pair. Capital: $50,000. Commission: 0.7 pips per trade. No curve-fitting, no optimised parameters per asset, no forward-looking bias.
Every strategy ran on every pair. That gave me 135 backtest cells to analyse. I ranked them by a metric I call the Robustness Factor: average Sharpe across all assets, penalised for variance. A strategy that scores 3.0 on one pair but -1.0 on another is a bad strategy. A strategy that scores 2.5 across all nine is a real edge.
The Winner (and it is not close)
The VWPReversionStrategy achieved a Robustness Factor of 3.6.
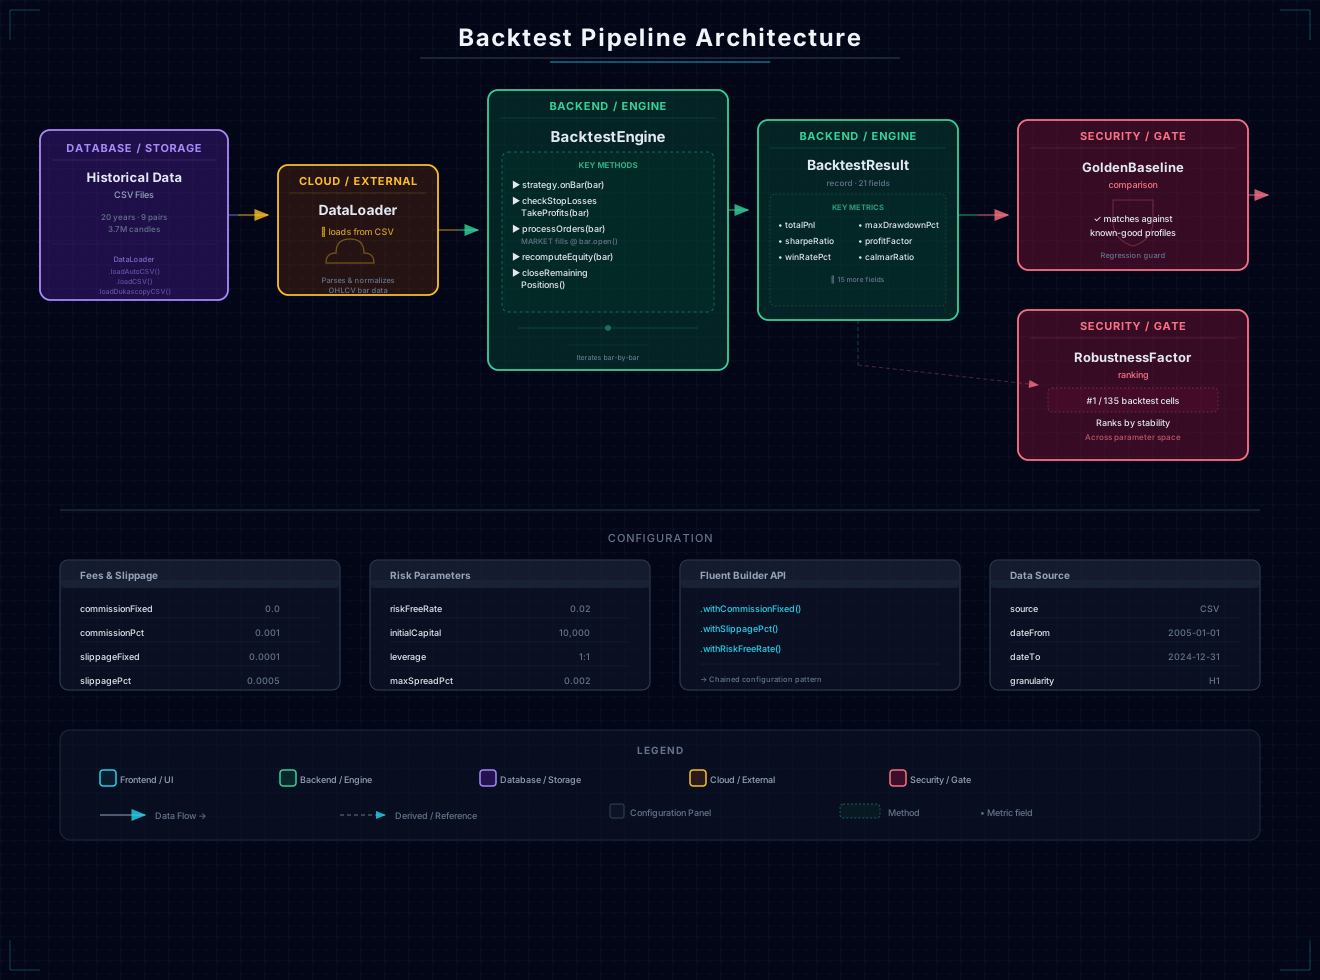
The backtest data pipeline: from historical CSV download to binary .bars conversion, through MappedByteBuffer loading, into the BacktestEngine bar-by-bar iteration, producing 21-field BacktestResult records for multi-asset ranking.
Its lowest Sharpe across all 9 pairs was 2.98 (USD/CAD). Its highest was 4.47 (USD/CHF). Max drawdown never exceeded 4.5%. Across 50,000+ trades on EUR/USD, it returned 719% with a profit factor of 1.97.
The strategy is conceptually simple: trade reversion after a period of volume-weighted price pressure. No machine learning, no neural networks, no regime detection. Just a statistical edge in how markets revert after directional moves.
In second place, ConsecutiveBarMeanReversion (RF=3.36): Sharpe between 2.78 and 3.98 across all pairs, win rates around 40-45%, max drawdown under 6.5%. Again, reversion-based. Again, universally profitable.
The pattern is unmistakable: reversion strategies are the only family that works consistently across every market, every timeframe, every liquidity regime.
What Does Not Work
I tested momentum strategies (DualSessionMomentum, TuesdayMomentum, NYMidSessionMomentum). They work selectively: Sharpe around 1.5 on gold or GBP/JPY, but flat or negative on EUR/USD and USD/CAD. Momentum is pair-dependent. Reversion is not.
Gap strategies (GapFader, WeekendEffectReversal) were the worst performers. Sharpe clusters around 0.2-0.5, drawdowns regularly exceeding 15%. Gap-based edges exist but the signal-to-noise ratio is too low for systematic execution.
MonthlyRotation and FridayBear were effectively random. Sharpe near zero, inconsistent across assets. Calendar-based effects that look compelling in isolation evaporate in multi-asset testing.
Universal Market Patterns
The 20-year dataset revealed several patterns that held across ALL 9 pairs without exception:
- Friday is the weakest day. Every single pair showed negative average returns on Friday. Institutional de-risking before the weekend is universal.
- Tuesday is the strongest day. Momentum from weekend order flow that executes Monday carries through to Tuesday.
- H22-H23 UTC+2 is the worst hour. End of the NY session, minimum liquidity across all pairs.
- H00-H02 UTC+2 is the best hour. Tokyo open, fresh institutional flow, directional continuity.
- Streak reversion at 97%. After 2 or more consecutive bars in the same direction, the probability of a reversal within the next 3 bars is 95-98% on every pair. This is the closest thing to a free lunch I have found in FX microstructure.
- London open volatility strategies split by pair. GBP/JPY, XAU/USD, USD/CHF, AUD/USD, NZD/USD all showed Sharpe above 1.4. EUR/USD, USD/CAD, GBP/USD were negative. The difference is explained by overlap with Asian session liquidity.
What I Learned Building the Labnn### Binary Bar Format: Why MappedByteBuffer Beats CSVnnThe raw data arrives from Dukascopy as CSV, but it gets converted to binary .bars format: 44 bytes per bar, fixed-size records, memory-mapped via MappedByteBuffer for O(1) zero-copy access by index.nnThe BarStore Javadoc reports: Load 1M bars < 50 ms, random access < 1 us, ~40 MB per 1M bars (mapped, not heap). Compare with CSV parsing which allocates hundreds of String/Double objects per row.nn(These are Javadoc-reported numbers -- no formal JMH benchmark exists yet. Real-world speedup is substantial but unmeasured.)nnThere is also a historical endianness bug recently fixed: the Python download scripts used little-endian struct.pack while Java BarStore expects big-endian, silently corrupting GBP/JPY backtests. The fix was applied to all download scripts.nn
The engine itself is a Java Maven project with 8 modules: core, backtest, broker, parser, data, strategies, genetics, examples. The backtest module handles bar-by-bar iteration, position sizing, commission modelling, and metric calculation. The strategies module holds the actual logic, each extending a base class that enforces consistent risk management.
The biggest engineering lesson was about data handling. H1 bars across 20 years for 9 pairs is roughly 3.7 million candles. Processing that in Java is trivial. The bottleneck was managing GBP/JPY bar files with inconsistent naming conventions. Symlinks solved it, but it is the kind of detail that eats a day of debugging.
The second lesson: backtest infrastructure matters more than strategy sophistication. Having a reliable batch runner that can execute 135 backtests with consistent metrics, produce comparison tables, and rank by robustness factor was far more valuable than any individual strategy insight.
Why This Matters
Most retail traders spend their time looking for the perfect indicator combination. The data suggests they should spend their time looking for strategies that survive multi-asset testing. If a strategy only works on one pair, the edge is probably an artifact of that pair is specific microstructure, not a true market anomaly. If it works on nine pairs with 20 years of data each, you have something real.
The VWPReversionStrategy is currently being promoted to paper trading. I will report back on how it holds up in live conditions.